There are approximately 5,300 fully registered psychologists working in regional, rural and remote (RRR) Australia, representing 21.5 per cent of the fully registered psychologist workforce (estimate based on 2011 data from the Psychology Board of Australia and the Australian Psychology Workforce Survey, 2008).1 In the past, statistics on the RRR psychology workforce have been highly variable due to poor collection of data and the use of unreliable measures of remoteness. This profile of the RRR psychology workforce in Australia presents data from a number of reputable sources using the revised ARIA+ measure of remoteness.2
Distribution of psychologists in RRR Australia
Fully registered psychologists The best data available on the distribution of psychologists in RRR Australia was gleaned from the 2008 Australian Psychology Workforce Survey, which was a comprehensive and representative survey of 11,046 psychologists initiated by the Council of Psychologists Registration Boards and conducted in collaboration with the APS in 2008 (Mathews, Stokes, Crea, & Grenyer 2010). The distribution of the 21.5 per cent of psychologists who provide services in RRR Australia is presented in Table 1. While this is a better spread of psychological services in regional and rural Australia than has been previously reported, there continues to be a need to attract more psychologists to these locations.
Table 1. Distribution of psychologists in RRR Australia (source: Australian Psychology Workforce Survey, 2008).
| Revised ARIA+ classification |
% of total psychologists |
| Regional |
14.1% |
| Rural |
6.6% |
| Remote |
0.8% |
| TOTAL |
21.5% |
Psychologists with recognised specialist skills The only available data on the distribution of psychologists with recognised specialist skills in RRR Australia comes from APS College statistics. Table 2 indicates the RRR distribution of the 14.6 per cent of the total relevant APS College members who provide psychological services in these areas. This translates to 932 psychologists, and the distribution of these psychologists across the various specialties is presented in Table 3. The data indicate that just over 10 per cent of those psychologists with recognised specialist skills practice in regional locations, but that very few of these psychologists provide services in rural and in particular, remote locations.
Table 2. Distribution of relevant APS College members in RRR Australia (source: APS data as at May 2011)
| Revised ARIA+ classification |
% of total College members |
| Regional |
10.6% |
| Rural |
3.6% |
| Remote |
0.4% |
| TOTAL |
14.6% |
Table 3. Number of relevant members of each APS College in RRR Australia (source: APS data as at May 2011)
| Clinical Neuropsychologists |
38 |
| Clinical Psychologists |
531 |
| Community Psychologists |
11 |
| Counselling Psychologists |
108 |
| Educational and Developmental Psychologists |
78 |
| Forensic Psychologists |
65 |
| Health Psychologists |
53 |
| Organisational Psychologists |
34 |
| Sport and Exercise Psychologists |
14 |
| TOTAL |
932 |
Years of experience of psychologists
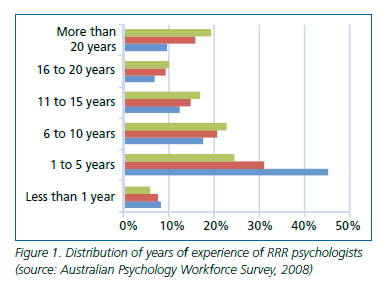
The distribution of years of experience of psychologists who provide services in RRR Australia is presented in Figure 1. Of note is the high proportion (approximately 45%) of relatively inexperienced psychologists working in remote locations. In contrast, almost 30 per cent of psychologists in regional locations reported having over 16 years experience as a psychologist.


Workplace settings of psychologists
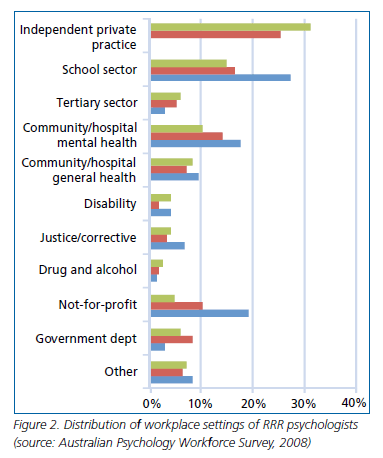
The distribution of the various workplace settings of psychologists who provide services in RRR Australia are presented in Figure 2. A high proportion of psychologists in regional locations reported working in independent private practice, followed by those working in the school sector. These findings are consistent with the data on the general psychology profession based on data from the Australian Psychology Workforce Survey (Mathews et al., 2010). Of particular interest is the comparative proportion of psychologists in remote locations that work in school and not-for-profit settings, and the lack of psychologists in private practice servicing these remote locations.

Recipients of services provided by psychologists
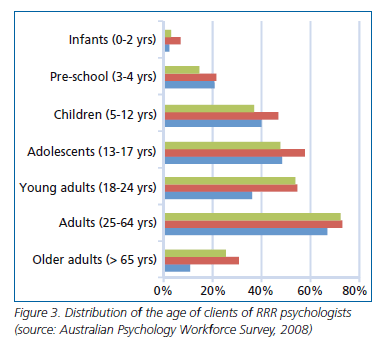
Age of clients The age distribution of the clients to whom psychologists provide services in RRR Australia are presented in Figure 3. Again consistent with the data for the psychology workforce in general, psychologists working in RRR areas reported spending the highest percentage of their time working with an adult population followed closely by the young adult and adolescent client groups (Mathews et al., 2010). There is little notable variability across the three RRR localities other than psychologists in rural areas reporting spending a higher percentage of time working with children and adolescents, and psychologists in remote locations spending a lower percentage of time working with young adults and older adults.

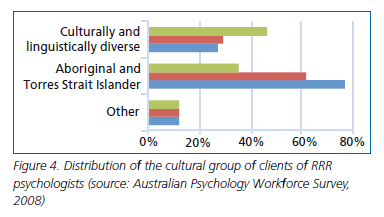
Cultural group of clients The cultural group distribution of the clients to whom psychologists provide services in RRR Australia are presented in Figure 4. As might be expected, psychologists working in remote locations reported that a high percentage of their time is directed at providing services to clients of Aboriginal and Torres Strait Islander background.
